Coda
Apple Music Analytics Terminal
Local-first intelligence
Treat your music history like a market.
A local analytics terminal for your Apple Music history. Coda brings together listening timelines, Top Charts, Sonic DNA, Replay Predictor, Library Health, Geography, and time-based analysis in one desktop app.
Recorded walkthrough
Single-app overview
Top Charts
market totals, discoveries, and candlesticks
Replay Predictor
projected replay-style rankings for the active range
Library Health
ghost tracks, volatility, item history, retention
Feature grid
Core views across the app.
Top Charts, Audio Flow, Genre Flow, Sonic DNA, Listening, and Geography each expose a different slice of your Apple Music history.
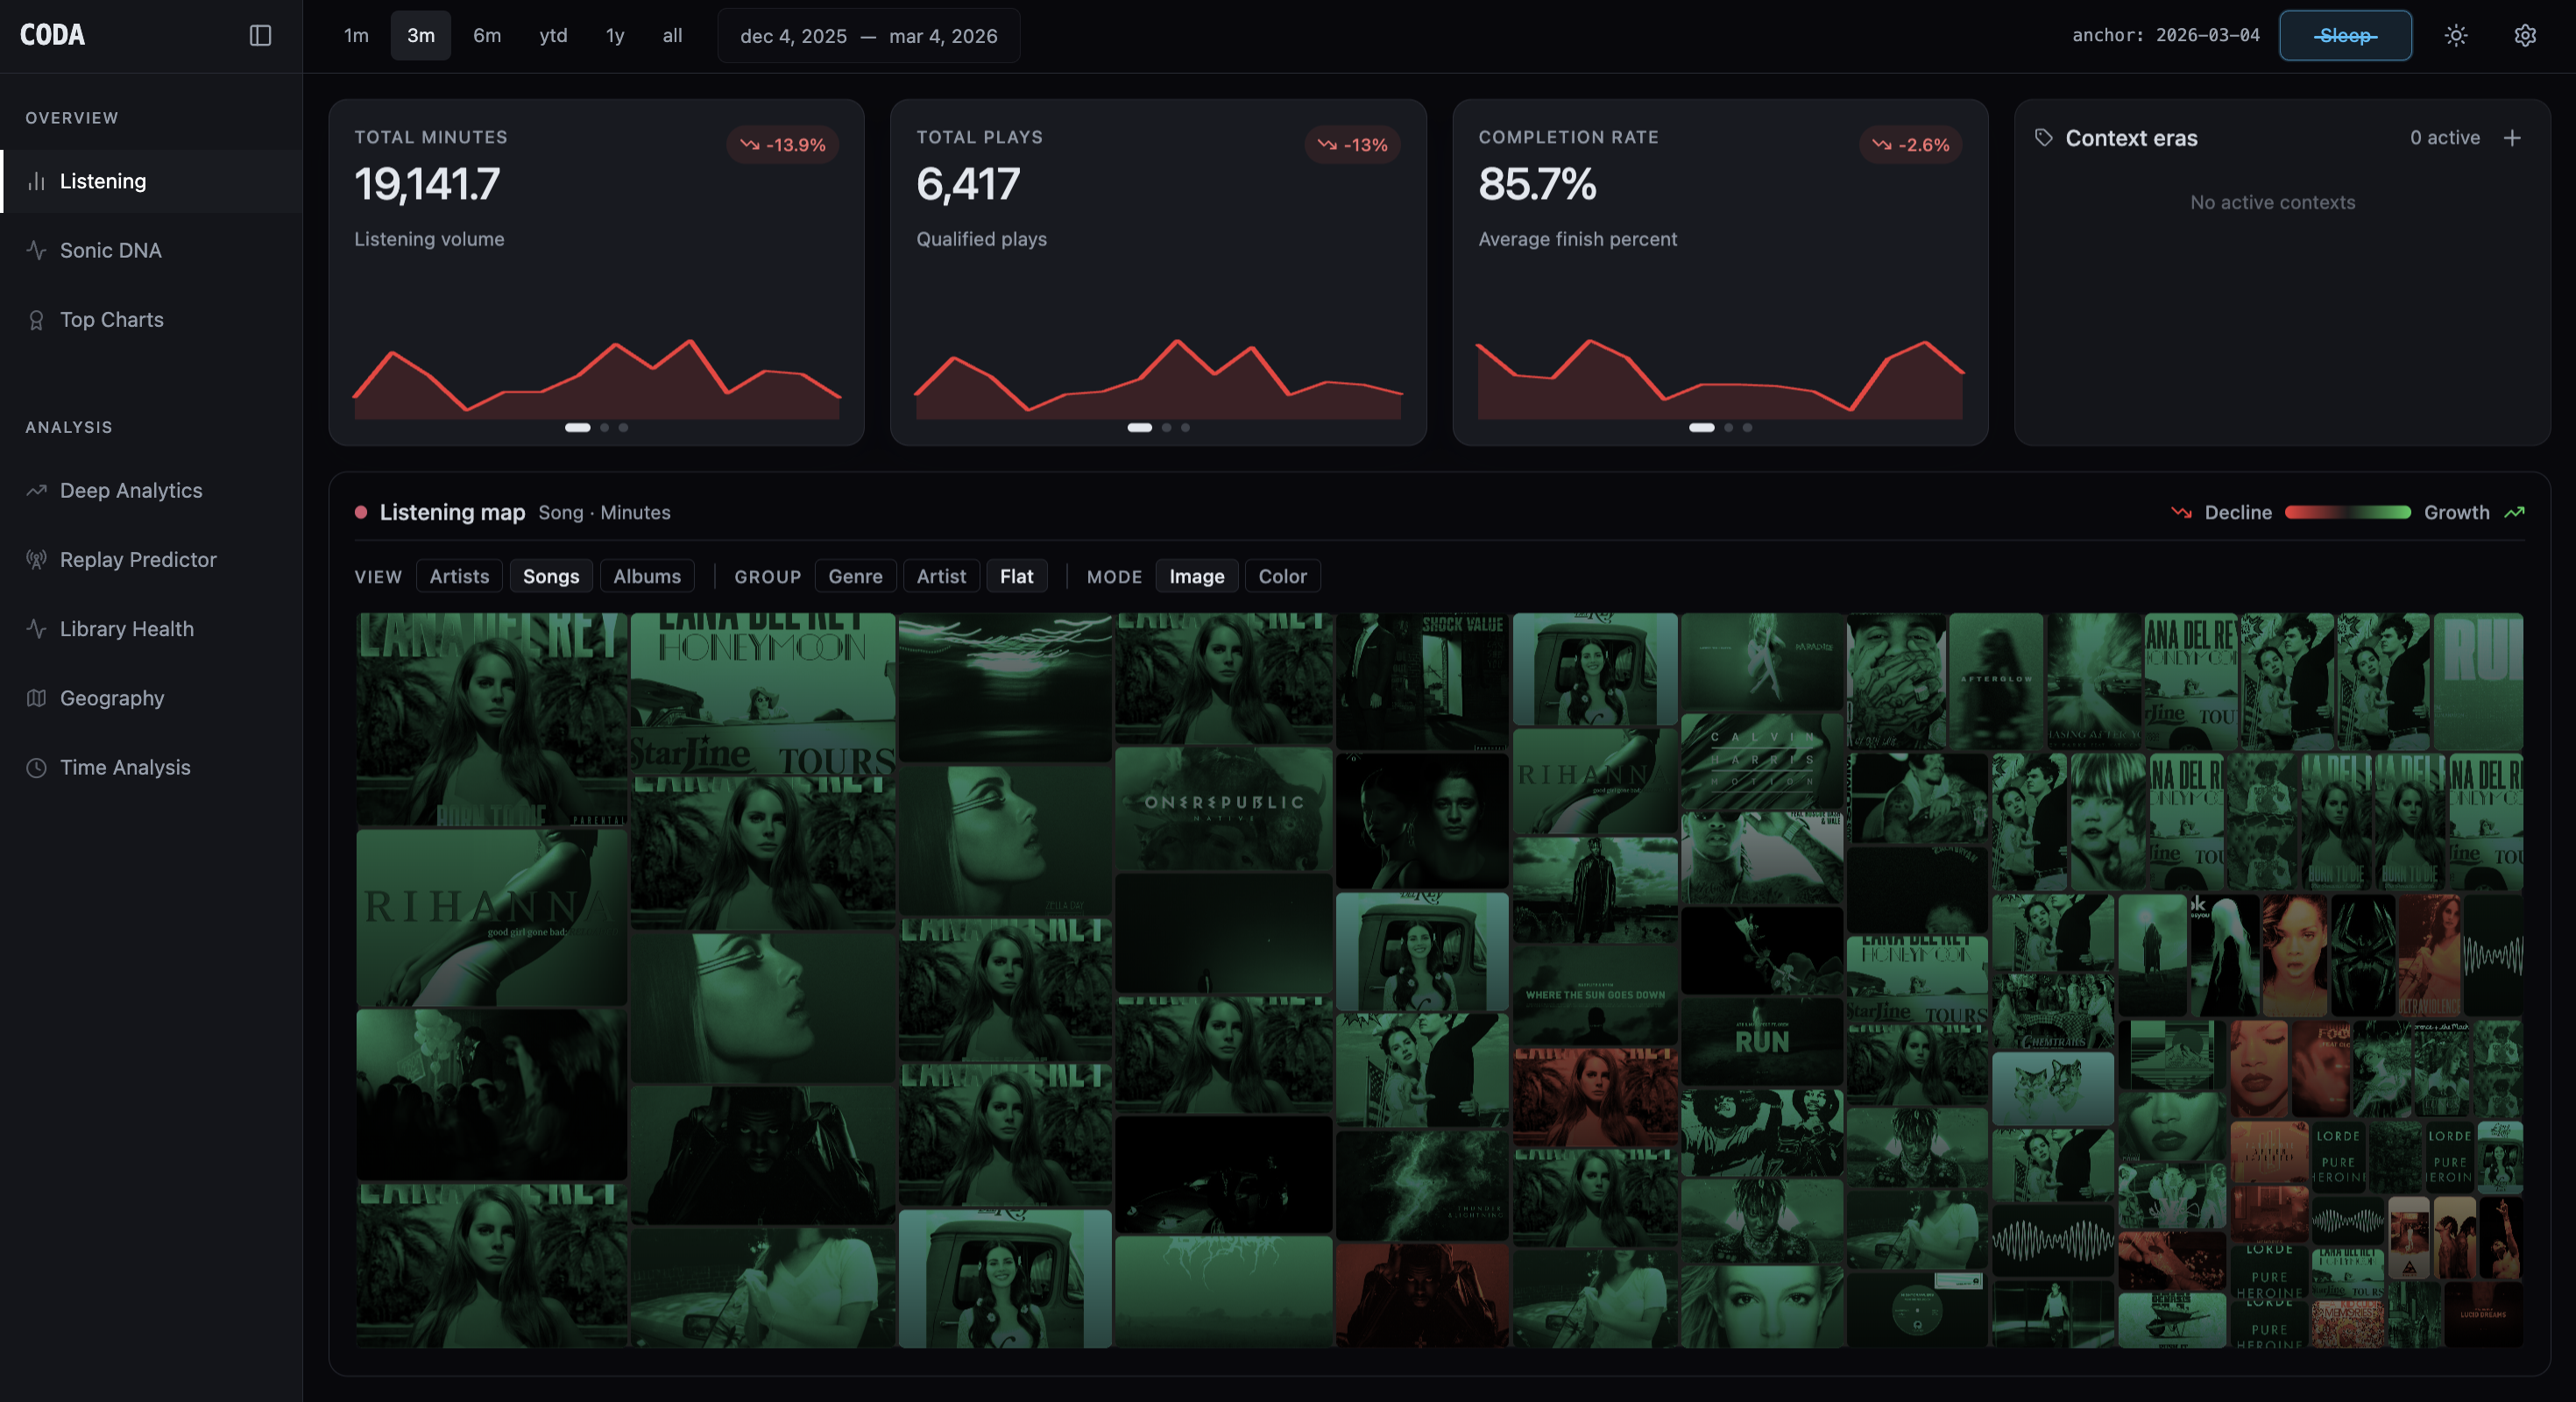
Listening
Listening summaries and map-driven views of your history.
The Listening tab combines high-level summary views with the main Listening Map so you can scan where activity accumulated across the selected range.
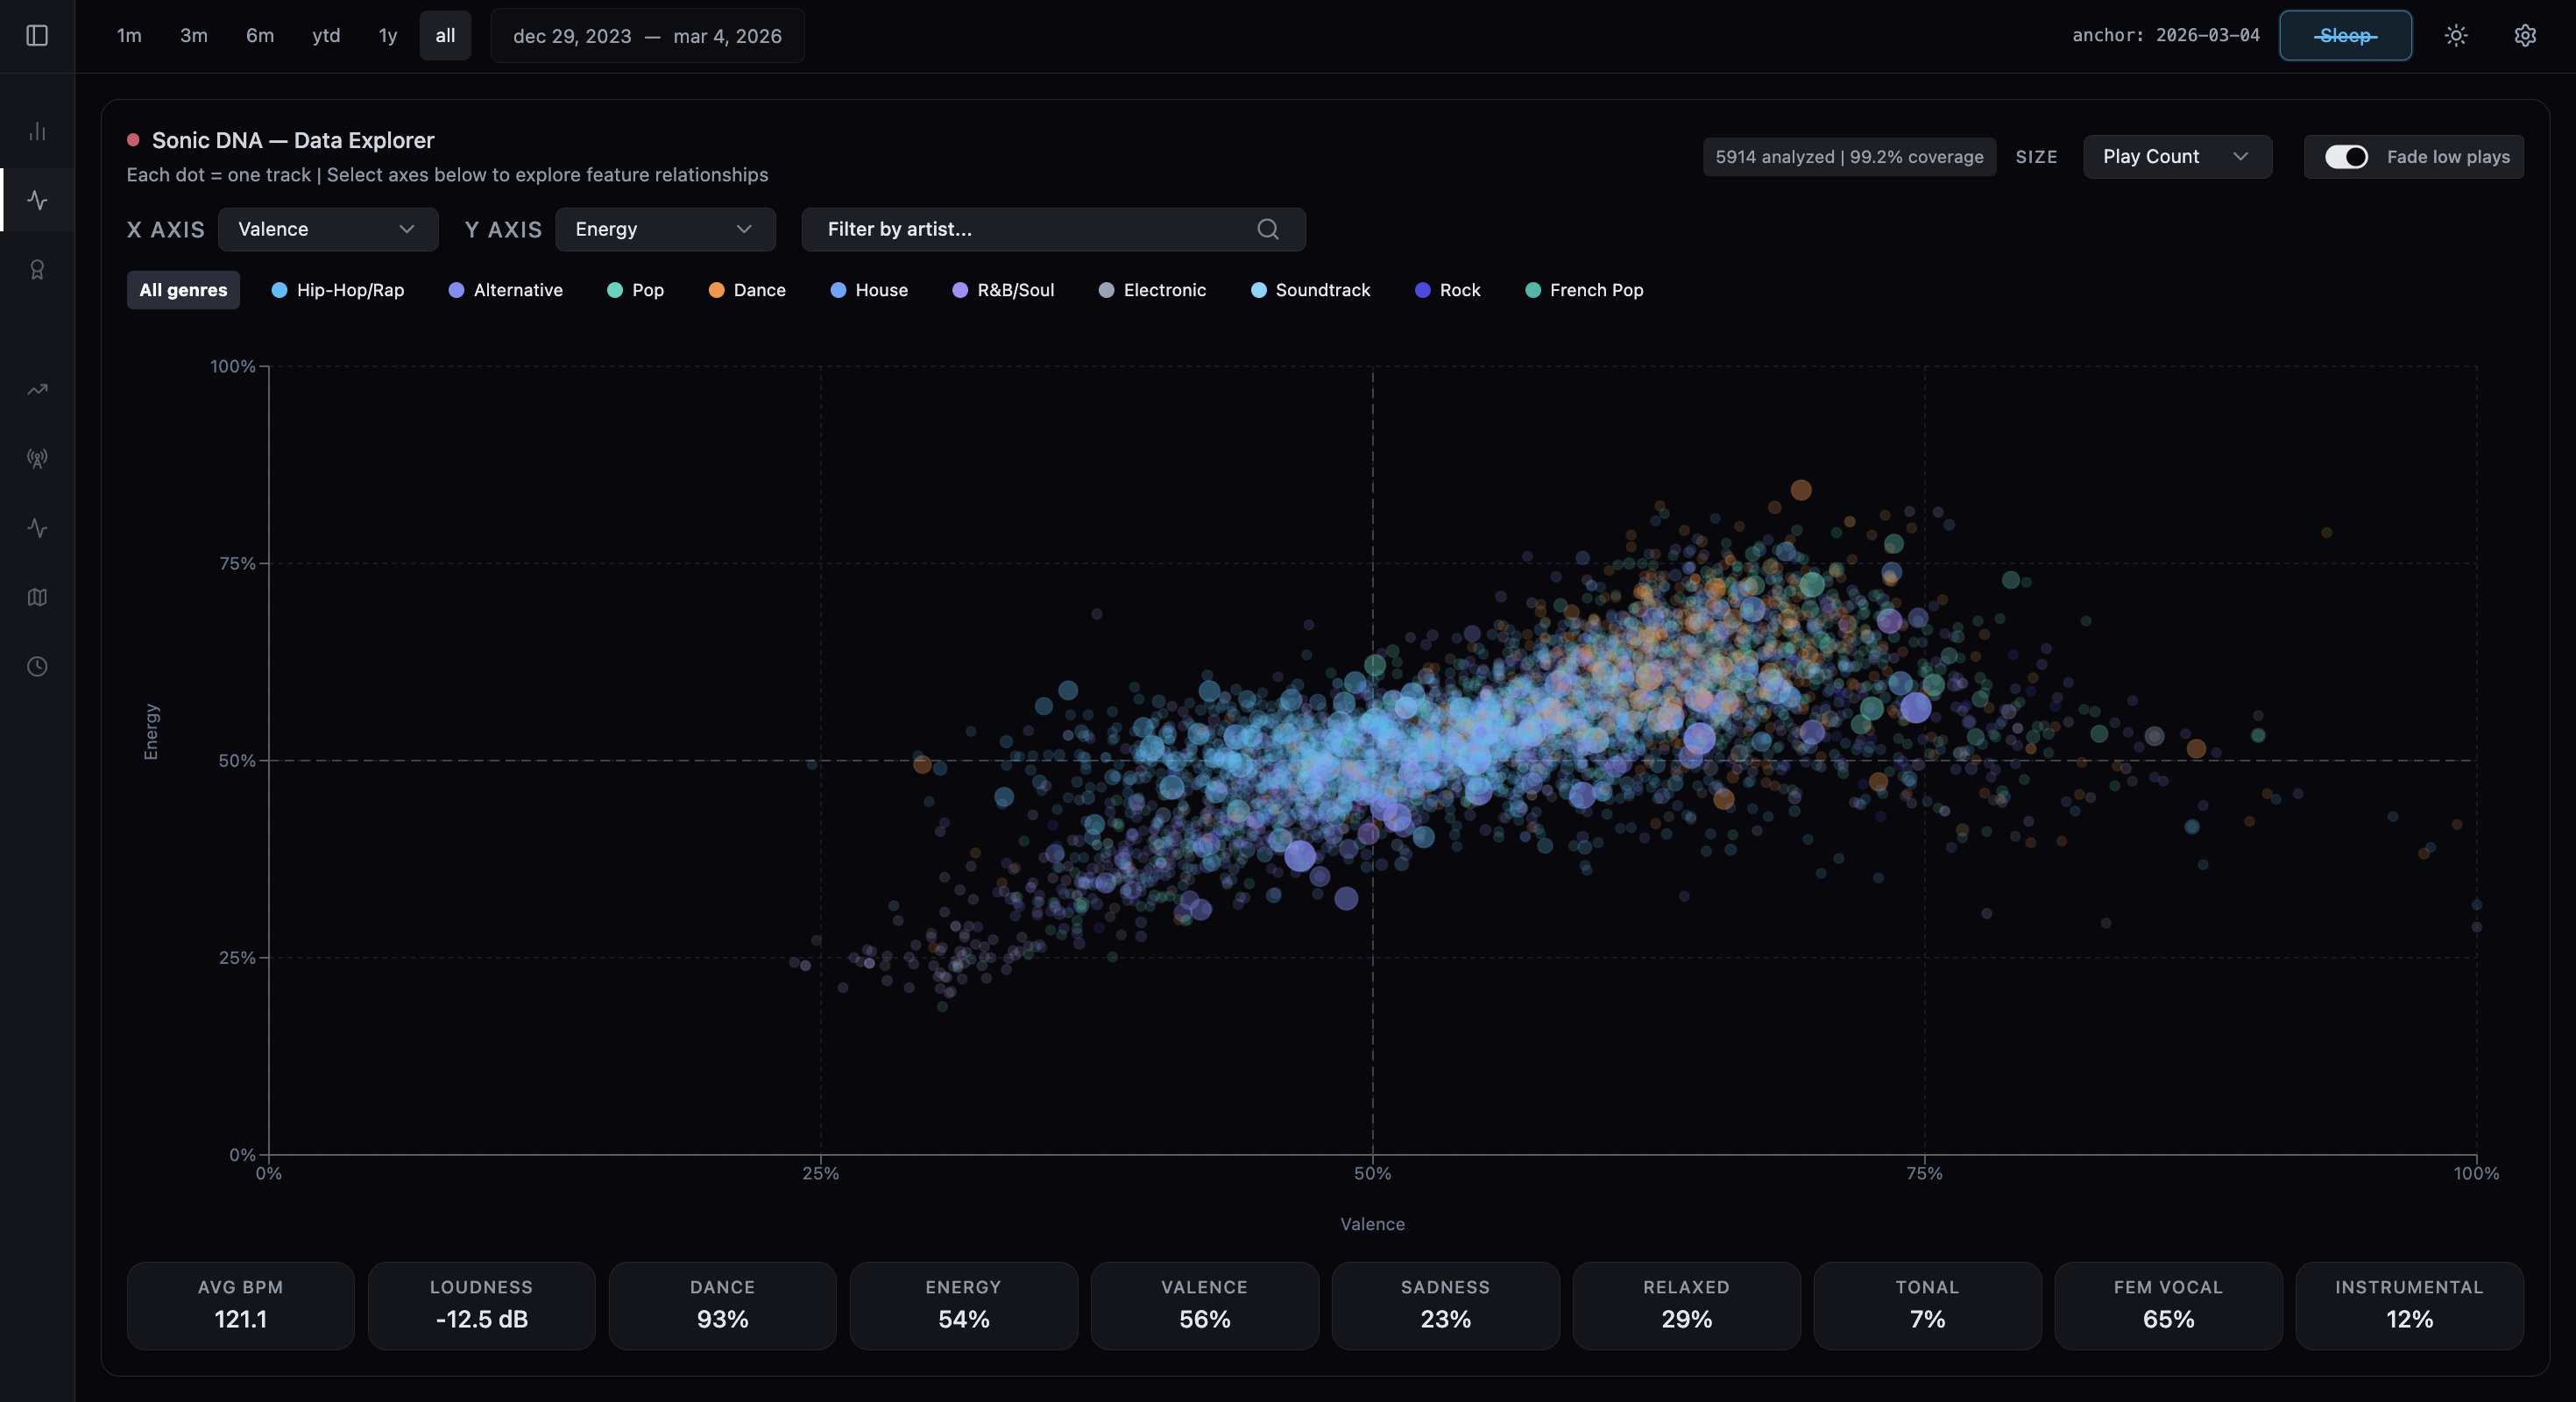
Sonic DNA
Audio feature exploration across your library.
Sonic DNA is an interactive scatter plot for valence, energy, danceability, BPM, loudness, and other analyzed audio features, with artist and genre filters built in.
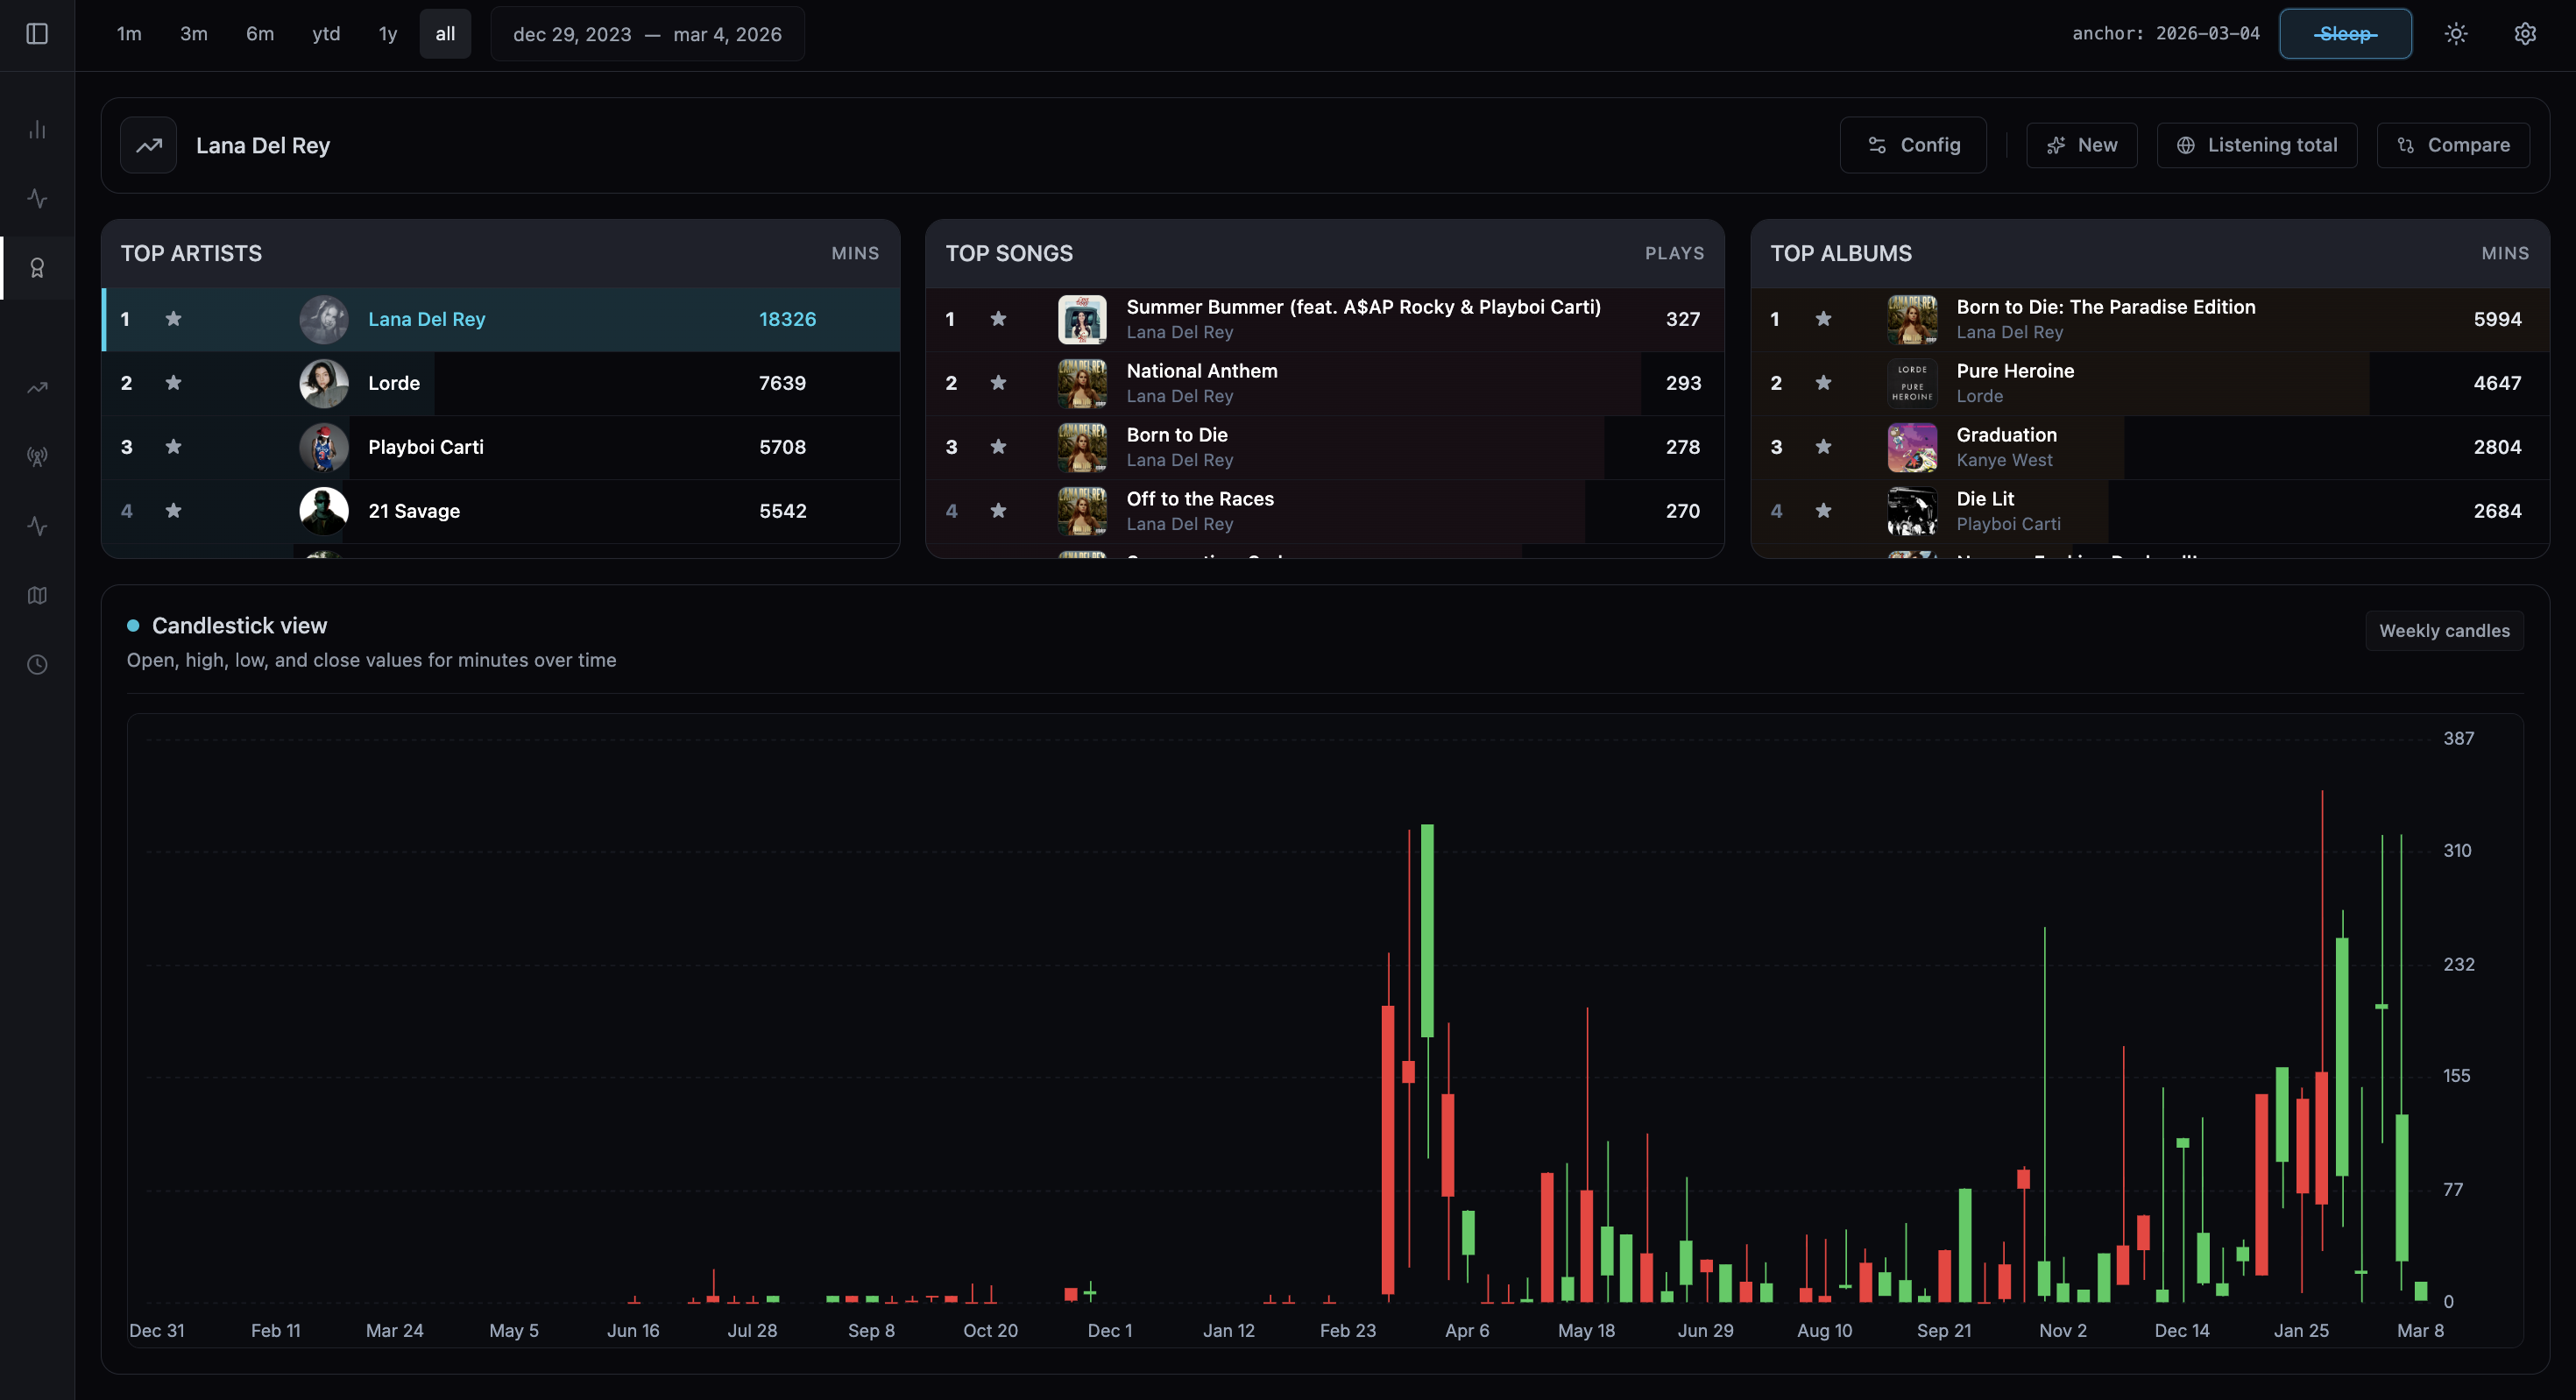
Top Charts
Candlestick and ranking views for artists, songs, and albums.
Coda's Top Charts module switches between total listening volume and new discoveries, then lets you drill into artists, songs, and albums over time.
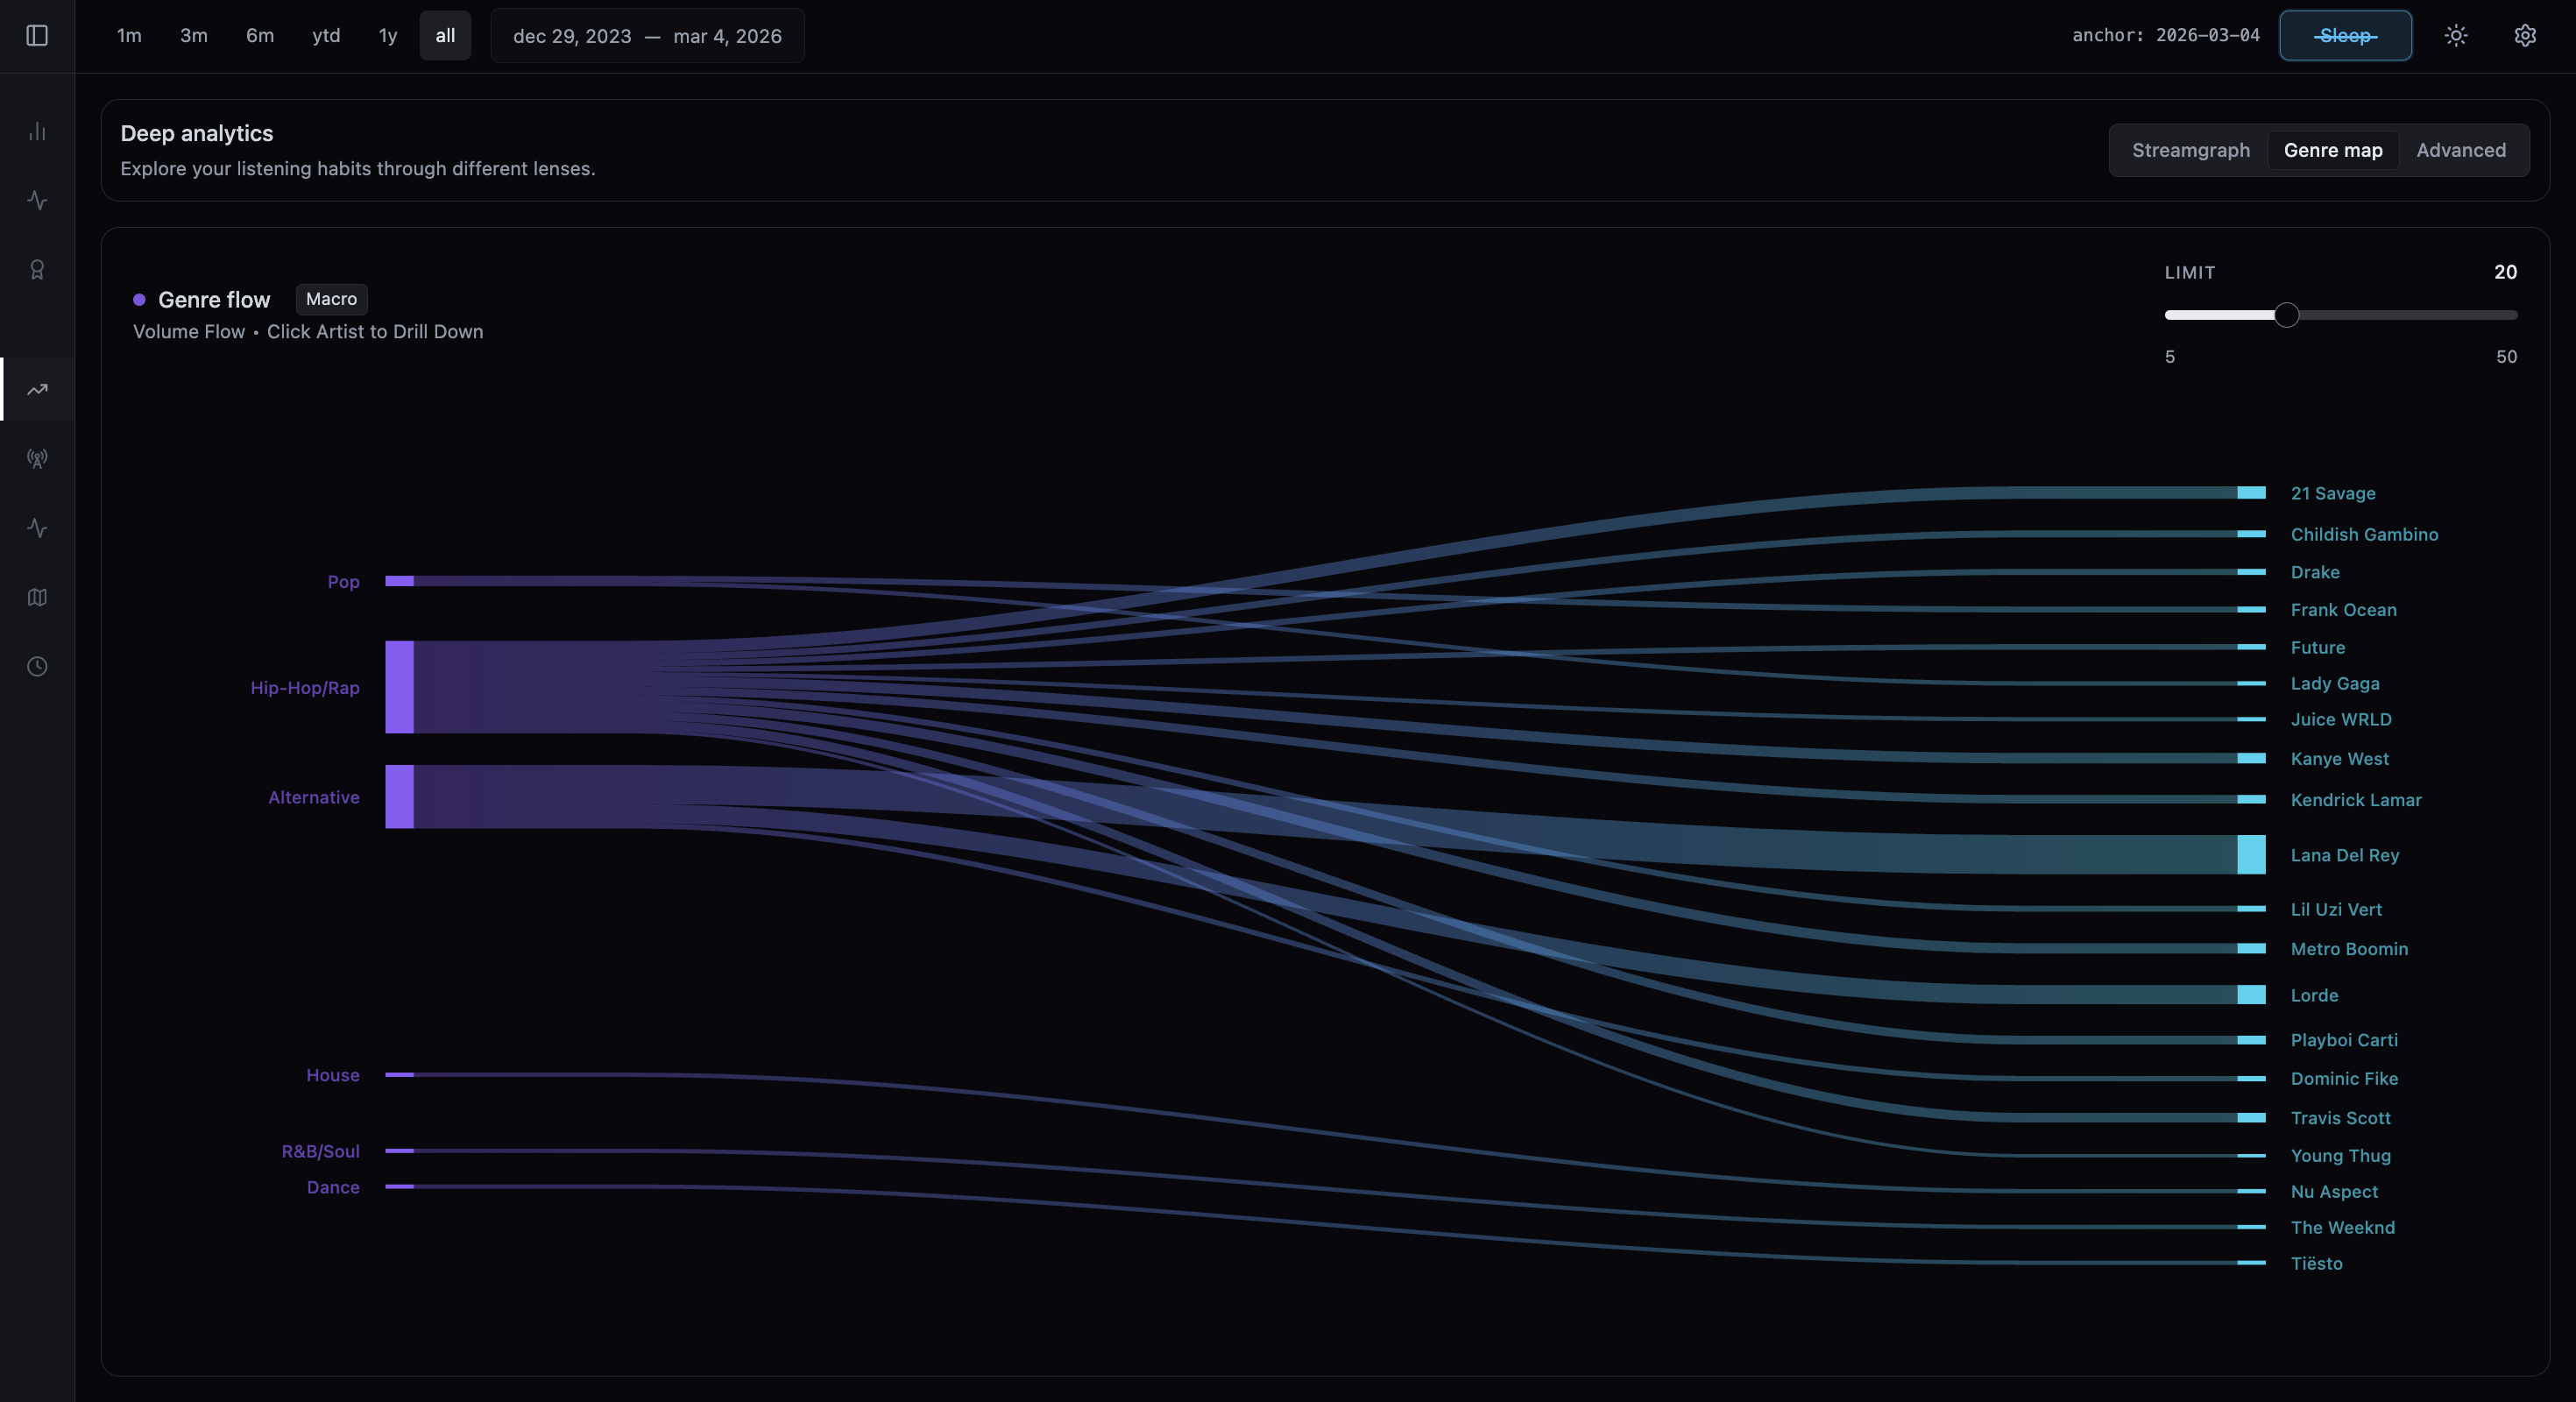
Deep Analytics
Macro genre flow plus artist deep dives.
The genre section starts with large-scale movement across genres, then lets you pivot into artist-level paths across songs or albums.
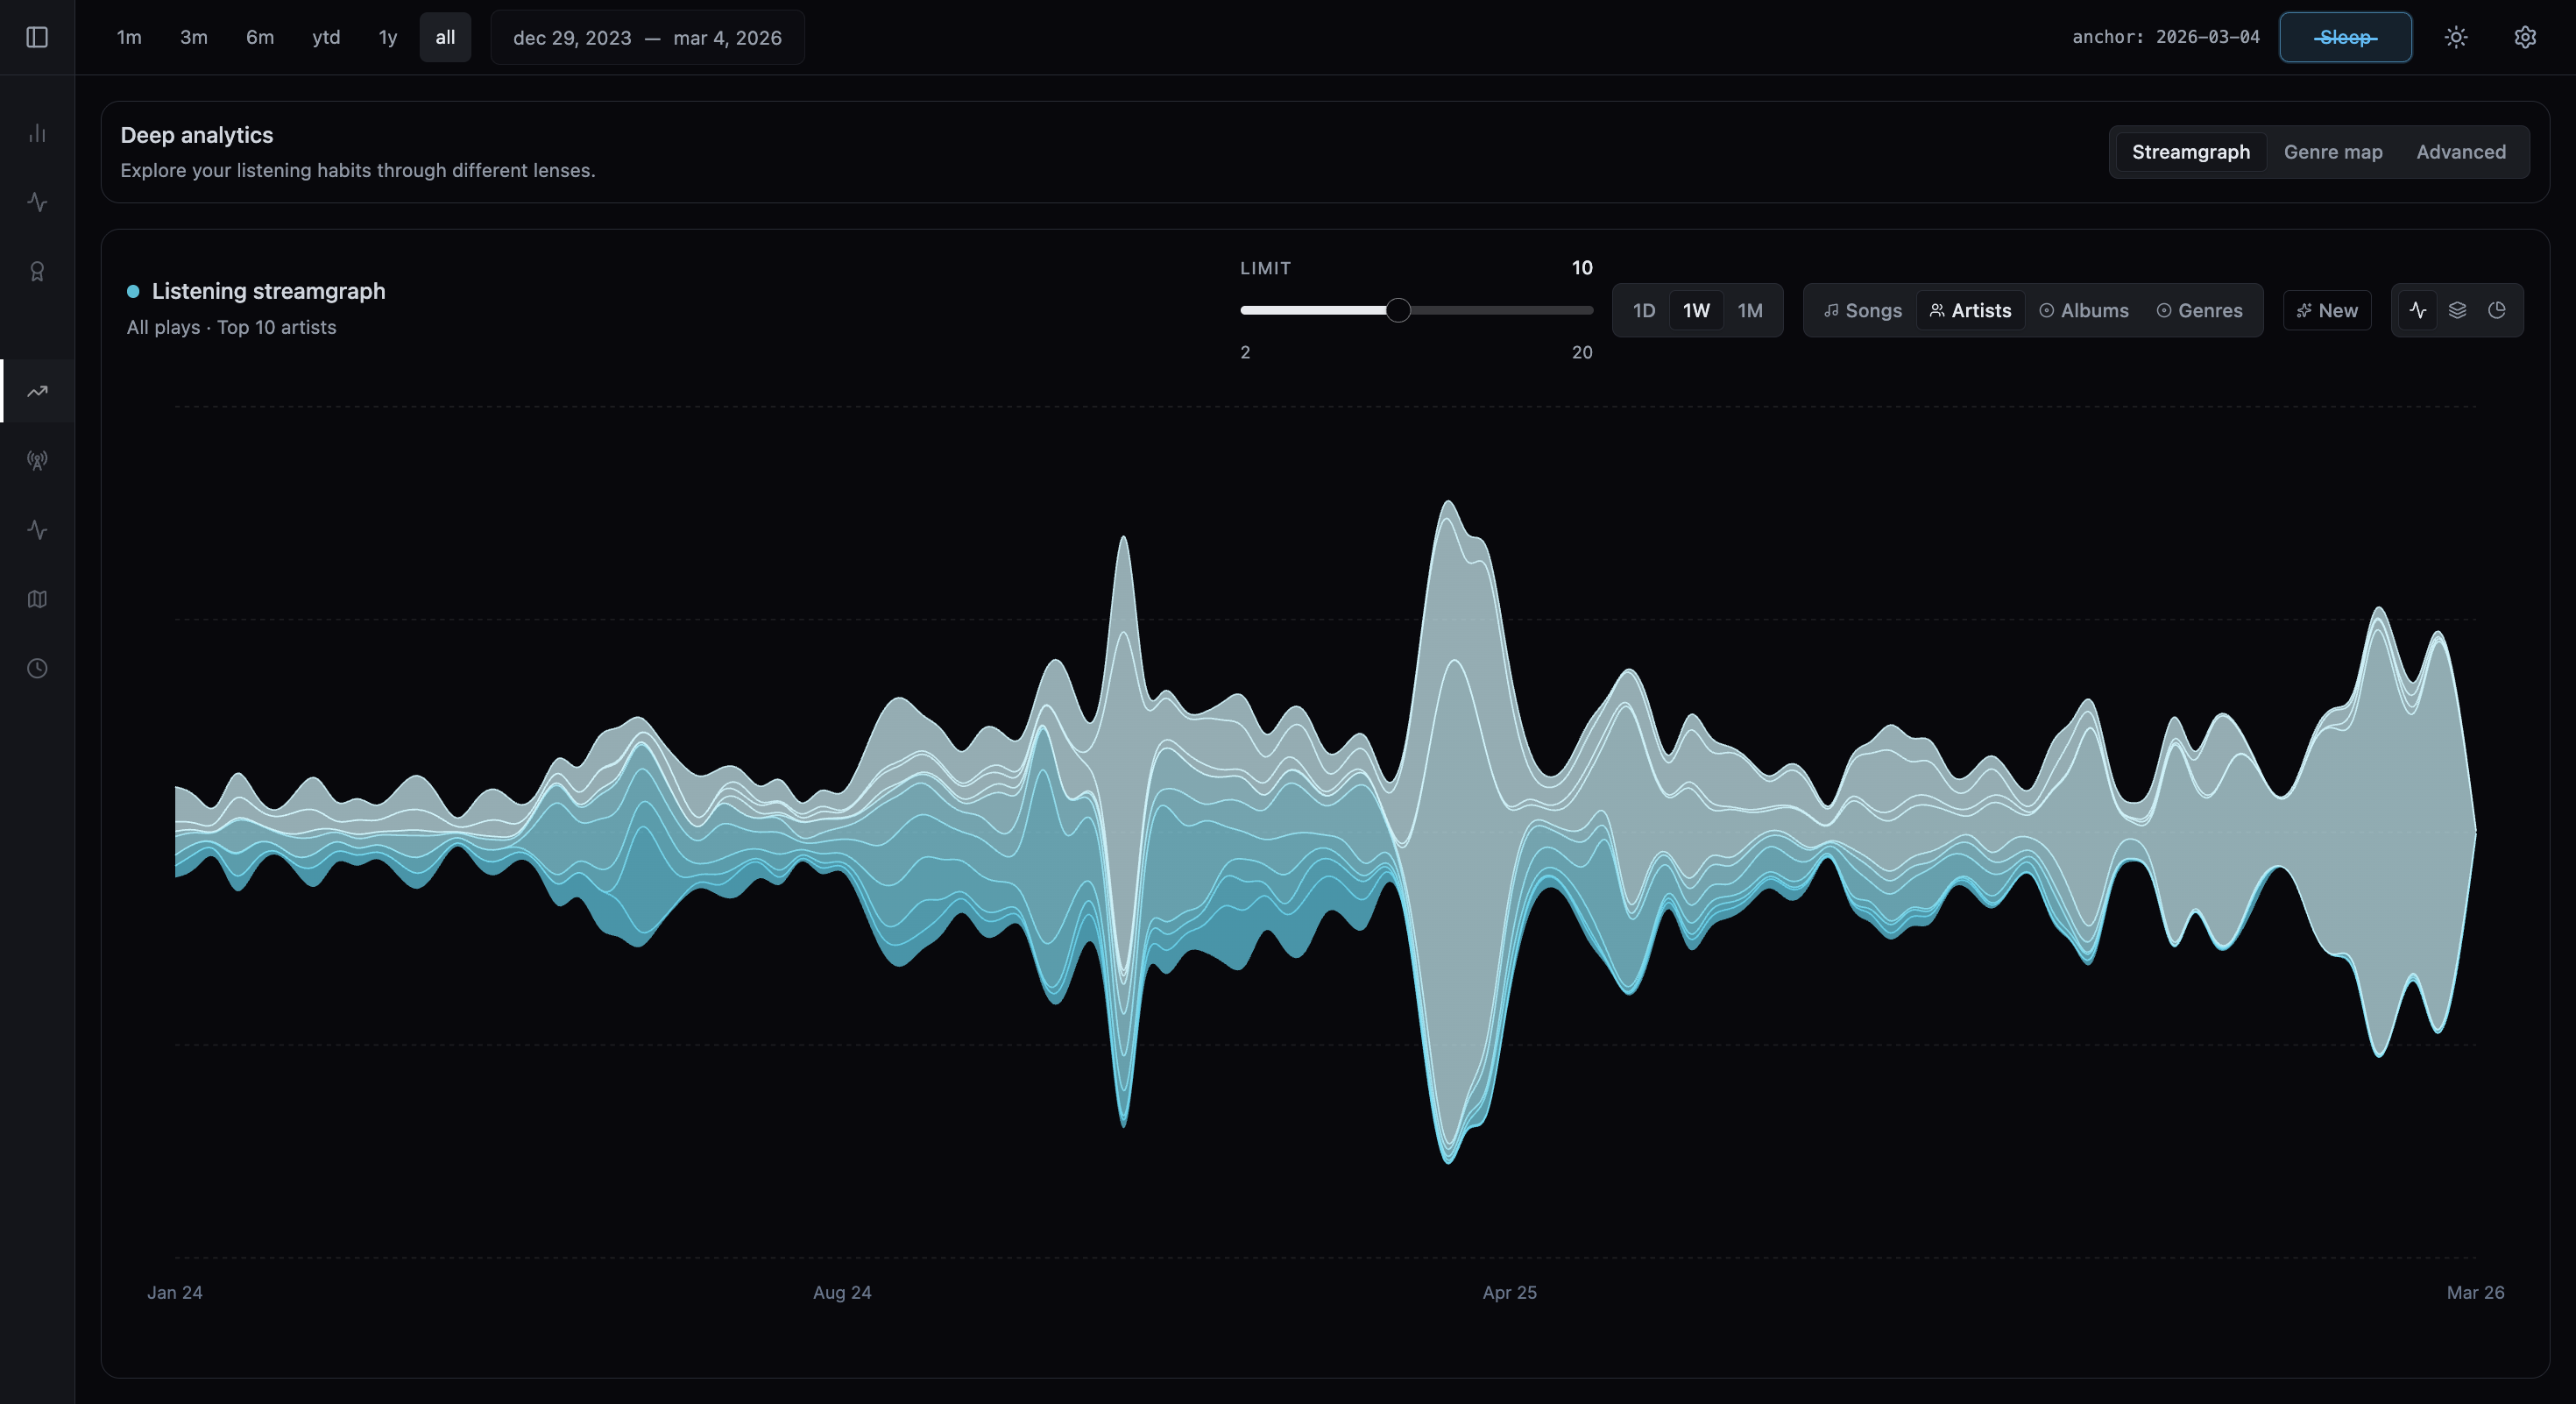
Deep Analytics
A listening streamgraph for artists, genres, songs, or albums.
The stream section of Deep Analytics includes Audio Flow, which plots all plays or first listens with day, week, and month grouping depending on the selected range.
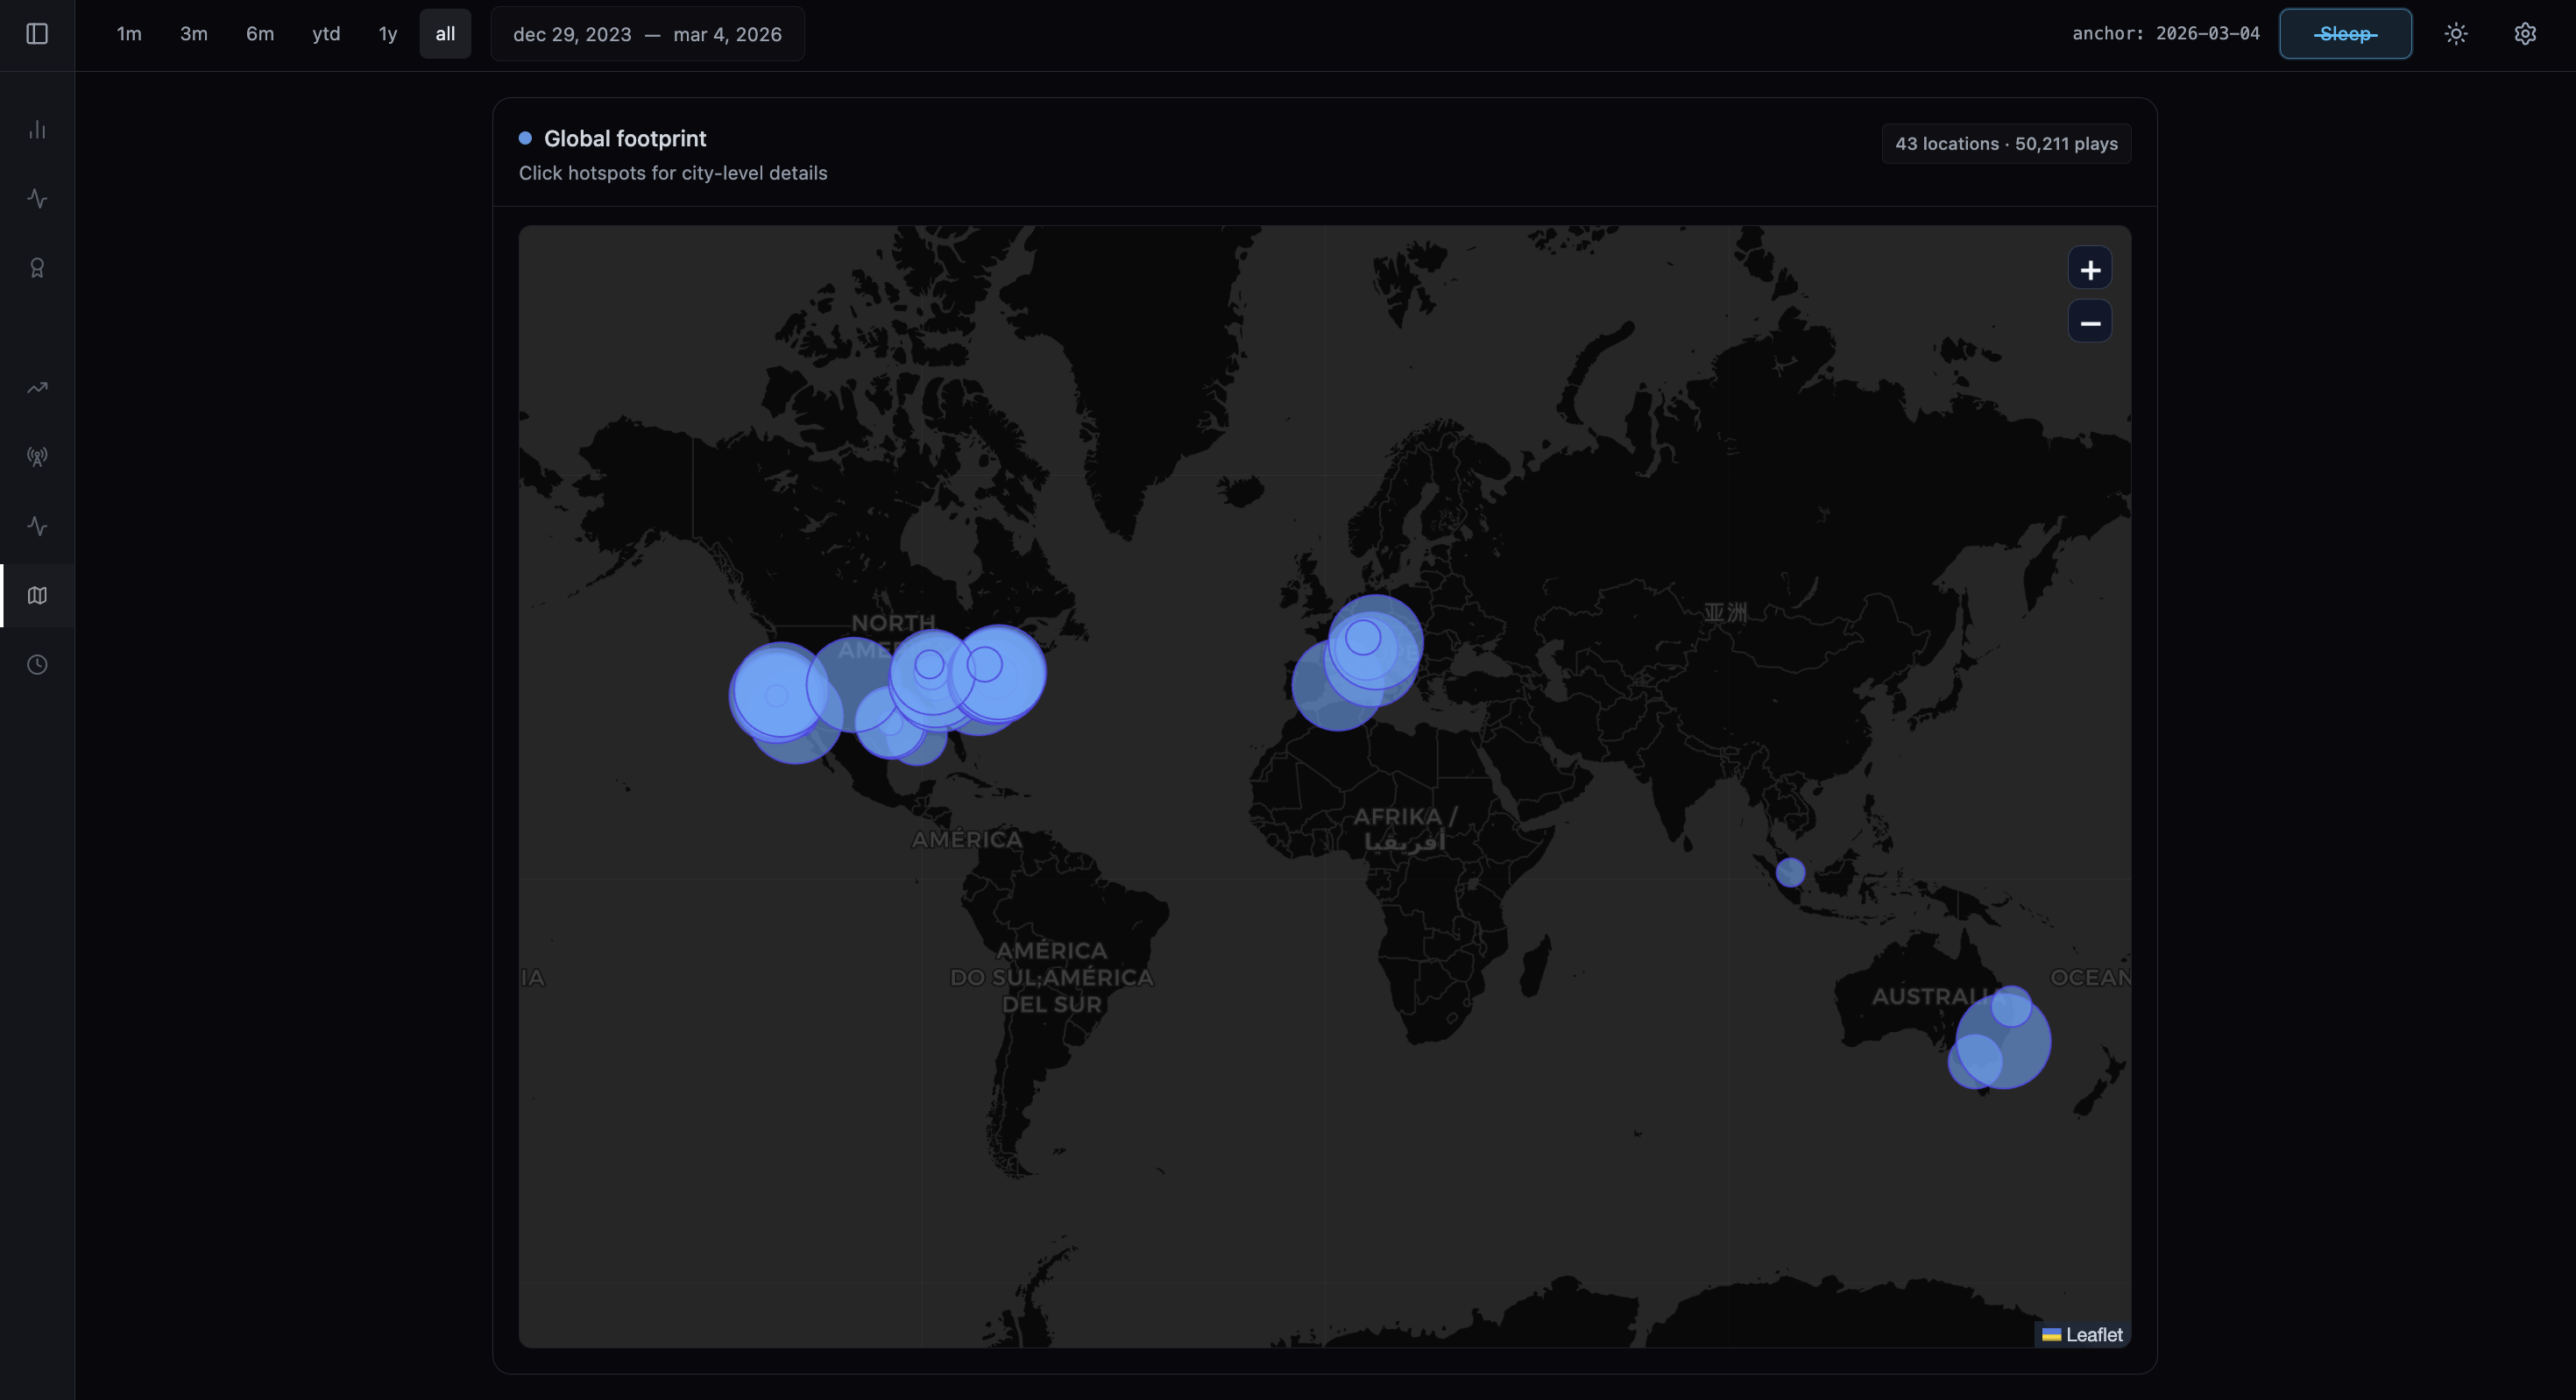
Geography
Map listening patterns by place.
The Geography module visualizes where listening happened and groups it in different ways, turning location history into another analysis surface.